Archives
-
IntelliTrace Causing Slow WPF Debugging in Visual Studio 2010
Just a quick note to myself (and others that may stumble across this blog entry via a web search): If a WPF application is running slow inside the debugger of Visual Studio 2010, but perfectly fine without a debugger (e.g. by hitting Ctrl-F5), then the reason may be Intellitrace.
In my case switching off Intellitrace (only available in the Ultimate Edition of Visual Studio 2010) helped gitting rid of the sluggish behavior of a DataGrid. In the “Tools” menu select “Options”, on the Options dialog click “Intellitrace” and then uncheck “Enable Intellitrace”.
Note that I do not have access to Visual Studio 2012 at the time of this writing, thus I cannot make a statement about its debugging behavior.
-
Recommended: IntelliCommand for Visual Studio 2010/2012
The Morning Brew is a great news source for developers for many years now. In a recent post it mentioned an extension for Visual Studio 2010 and 2012 called IntelliCommand that implements something that I had wanted for quite some time: A dynamic help for hotkeys.
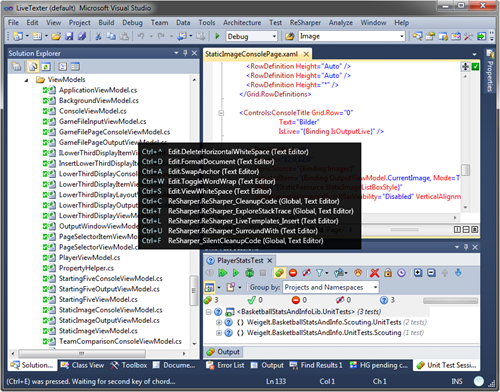
IntelliCommand shows a popup
- when you press and hold Ctrl, Shift or Alt (or combinations thereof) for a configurable amount of time, or
- after you press the first key combination of a chord shortcut key (e.g. Ctrl-E) and wait for an (independently configurable) amount of time.
In the following screenshot I pressed and released Ctrl-E, and after a short delay the popup appeared:
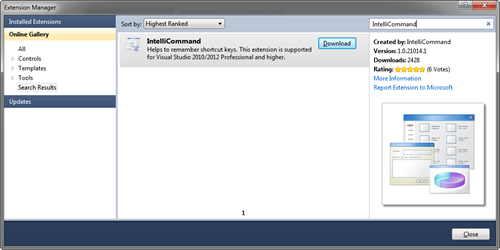
The extension is available in the Visual Studio Gallery, so finding, downloading and installing it via the Extension Manager is extremely simple:
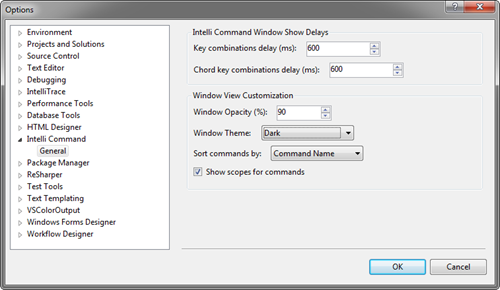
The default delays (2000 / 1600 milliseconds) are a bit long for my liking, but this can be changed in Tools – Options:
So far things are working great on my machine. Some known issues do seem to exist, though (e.g. that the extension doesn’t work on non-EN versions of Visual Studio). See the author’s comments in the announcement blog post and in the Visual Studio Gallery for more information.


